Study PLO Smarter with Aggregate Reports
Aggregated Reports are a powerful tool for improving your understanding of PLO!


Pot Limit Omaha is complex by nature. With four hole cards, the number of possible starting hands (over 270,000) grows exponentially. This makes understanding preflop ranges and hand classes a real challenge — especially if your goal is to build a structured, long-term strategy instead of relying on intuition alone.
The large number of preflop combinations also means you reach the flop with a variety of hands. For example, in a standard 100 BB single-raised pot, the Button opens around 126,000 combos. The Big Blind continues with roughly 90,000 combos by calling and about 27,000 by 3-betting.
For comparison, in No-Limit Hold’em at 100 BB, the Button opens around 580 combos, while the Big Blind calls about 530 and 3-bets around 182. The scale in PLO is much bigger.
Because of this, studying PLO requires structure. Instead of memorizing individual hands, you should think in terms of hand categories and understand how each category behaves in a given situation.
In PLO Genius, every hand belongs to one of 13 categories. Such a breakdown helps you see patterns. You can quickly check how a specific category performs and compare the expected value (EV) of different actions for individual combos.
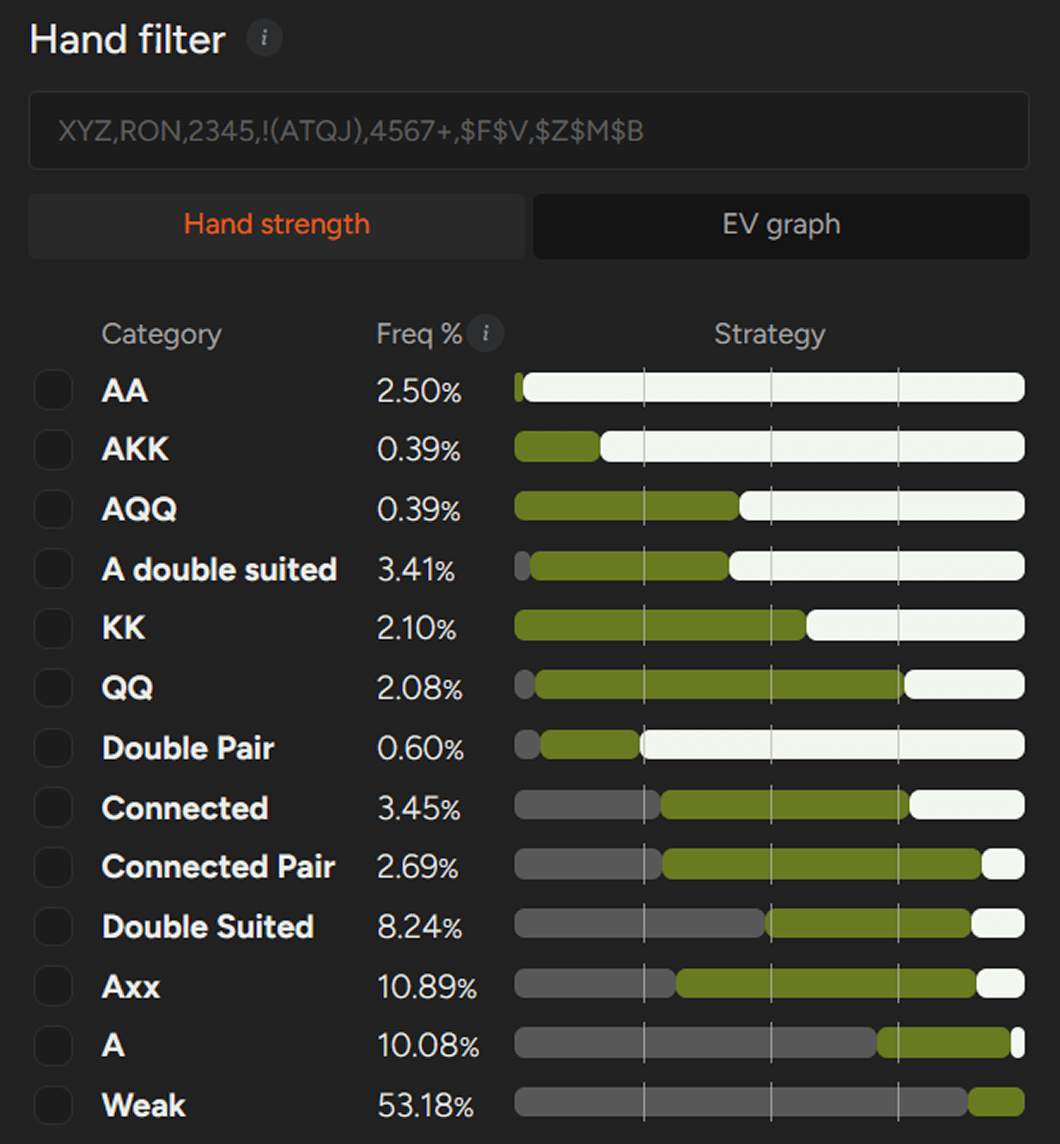
At the beginning, grasping how particular hand categories should be played can feel overwhelming. However, with enough repetition, you will develop an intuition for a solid preflop strategy.
The flop, however, adds another layer of complexity. You now have to consider board texture and how it interacts with ranges that contain tens of thousands of combinations.
Analyzing different flop textures and understanding how they affect both players’ ranges is not simple. That is why in this article, we introduce Aggregate Reports — a feature in PLO Genius designed to make postflop study clearer and more structured. With regular practice, it helps you turn a large amount of solver data into practical strategy.
What Are Aggregated Reports?
The most common way to study with a solver is straightforward. You set up a preflop action, choose a specific flop, and analyze what both players should do.
For example, the Button opens, the Small Blind folds, and the Big Blind calls. The pot is 7.5 BB, and the effective stack depth is around 100 BB.
In most cases, the out-of-position player checks. Then you look at how often the in-position player continuation bets and how the Big Blind should respond.
This method works well — but it only shows one board at a time.
Aggregated Reports in PLO Genius let you take a broader view. Instead of analyzing a single flop, you can review an entire group of boards at once. You see overall betting frequencies, sizing preferences, and how strategies shift across different textures.
Such data helps you understand patterns, not just isolated solutions.
In Pot-Limit Omaha, there are 22,100 possible flop combinations. Strategically, many of them should be approached in a very similar way. Changing one card slightly often does not change the optimal strategy by much.
To make the study practical, we reduced the total number of possible flops to 1,755 representative textures. These cover the full range of strategic situations while keeping the data manageable.
As a result, you can focus on learning how ranges interact — instead of getting lost in thousands of nearly identical boards.
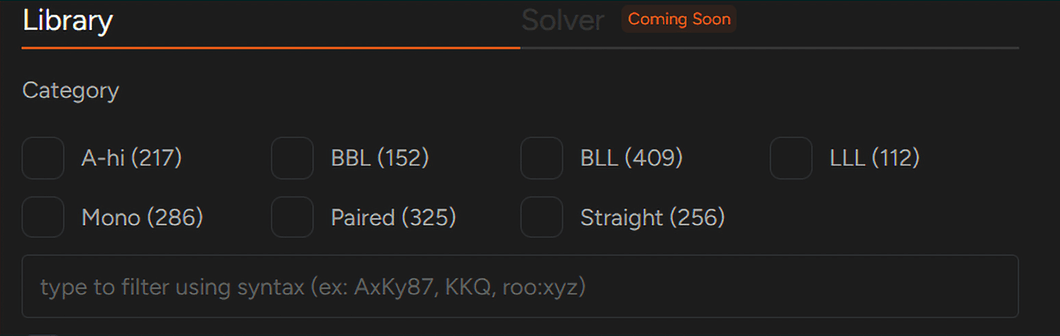
To make the postflop study more structured, we divided flops into seven main categories:
- A-high – unpaired, non-monotone Ace-high boards, with no straight possible
- BBL – unpaired boards with two high cards (T–K) and one low card (8 or lower), with no straight possible
- BLL – unpaired boards with one high card (T–K) and two low cards (9 or lower), with no straight possible
- LLL – unpaired boards with three low cards (9 or lower), with no straight possible
- Monotone – unpaired boards where all three cards are of the same suit
- Paired – any paired board, including trips
- Straight – boards where a straight is possible
A Practical Example
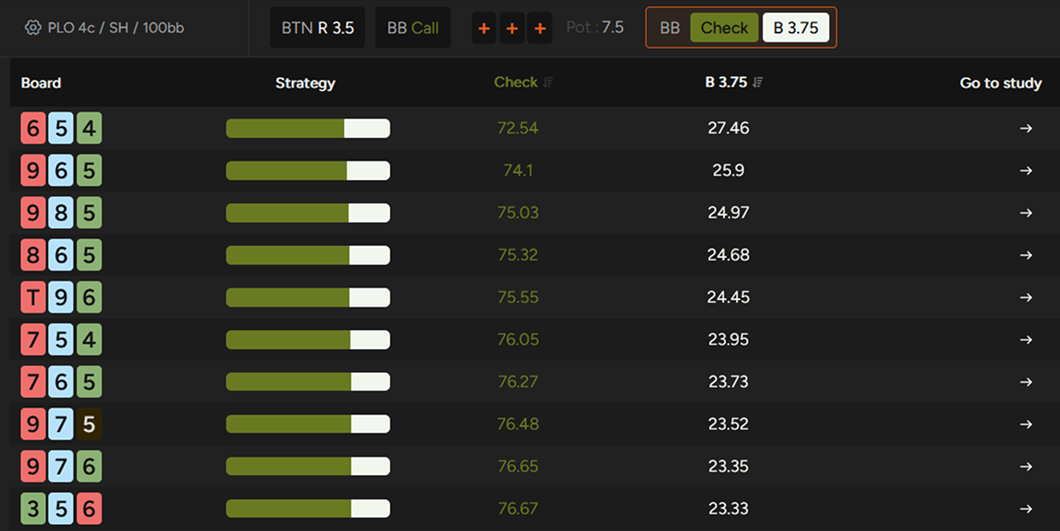
Let’s return to our example and use Aggregate Reports to review the Button’s continuation betting strategy versus the Big Blind at 100 BB (PLO50 rake). We will compare two board groups: Ace-high boards and straight boards.
On Ace-high boards, our solver assumes the out-of-position player checks 100% of the time (which is also a realistic baseline in practice). Facing this, the Button can c-bet quite freely. Across all 217 Ace-high boards, the solver bets on every board, with frequencies ranging from ~45% to ~64%, using a 4.95 BB bet into a 7.5 BB pot (66% pot).
Note: To keep the study process simple, our solutions use a simplified strategy and display the most common bet size.
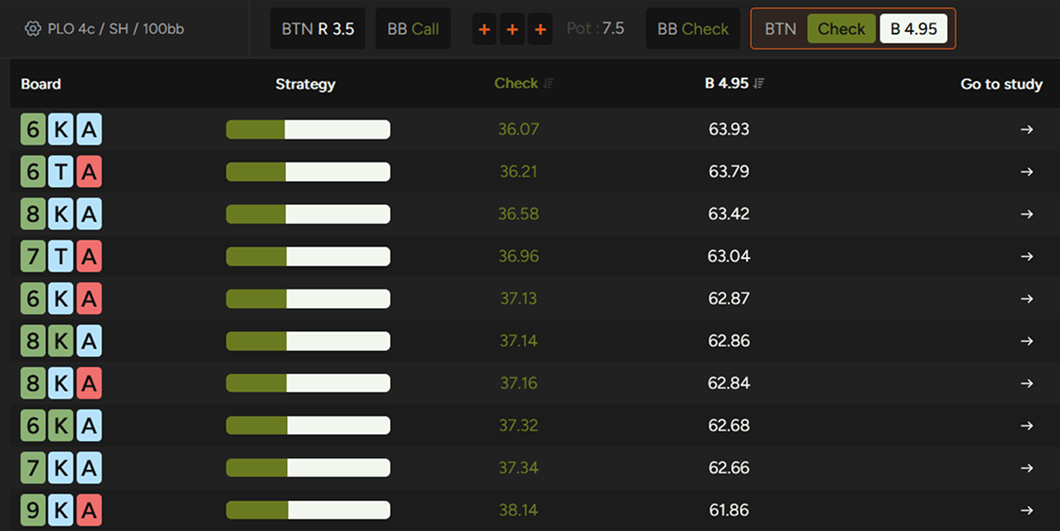
Let’s also look at how your opponents should respond to the solver’s strategy:
Even versus a two-thirds pot bet, the solver has the Big Blind check-raising around ~9% to ~15% of the time. In practice, many players do not reach that frequency, meaning you, as a preflop aggressor, often realize more EV than the baseline suggests.
So while Ace-high boards are not an “auto-bet” spot, they still give the preflop raiser plenty of room to c-bet. Most opponents defend too passively here, and that also means c-betting a bit more often than the solver can be a profitable exploit.
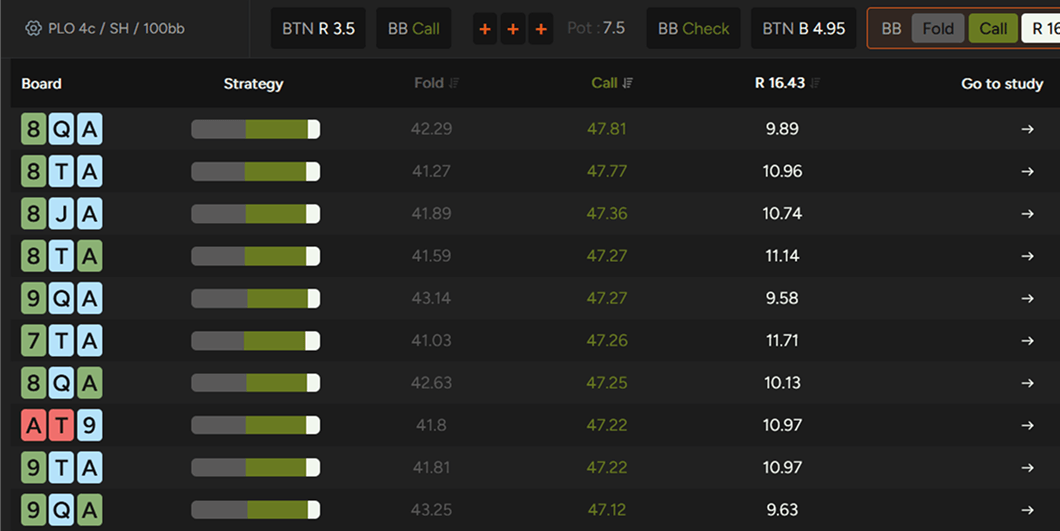
Now let’s look at a very different category: straight boards.
When a straight is possible, the Big Blind often connects more strongly because of how their defending range is structured. This structure shifts the equity between the ranges and changes the optimal strategy. As a result, the solver often prefers the out-of-position player to lead the flop at a relatively high frequency, since they hold more strong made hands — including straights — than they do on Ace-high boards.
Here is where things become more nuanced.
In low- and mid-stakes games, many opponents do not lead straight boards often enough — and some do not lead at all. That is an important factor to consider when choosing your continuation betting strategy.
If we look at straight boards in a vacuum — assuming the opponent should have a leading range but decides to check instead — the overall c-bet frequency does not drop dramatically. Across these boards, it still ranges roughly from ~41% to ~55%.
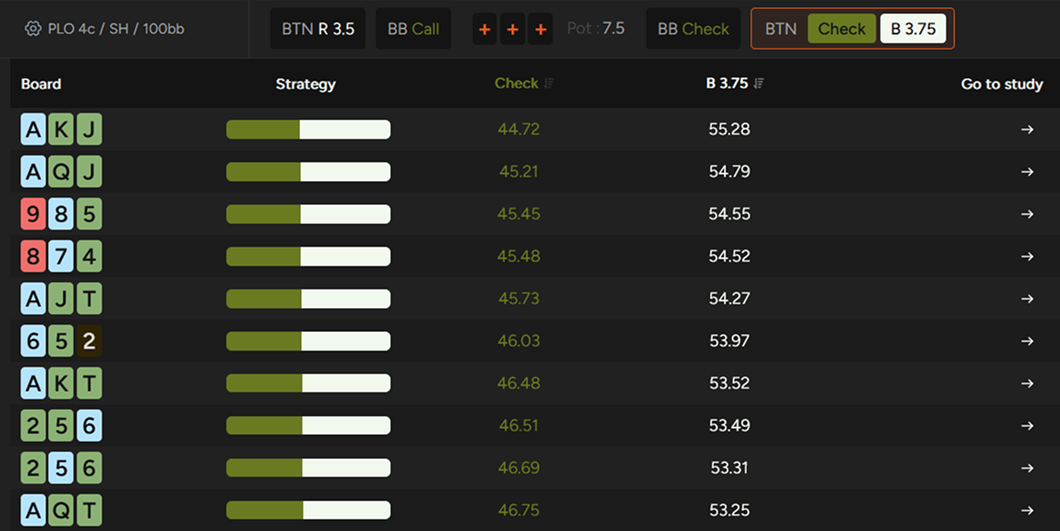
However, if you assume that your opponent never leads these boards, the situation changes. Their checking range becomes stronger, because it now contains more made straights that should have led but did not.
In that case, your c-betting frequency should decrease by a few percentage points.
How many exactly? That depends on the full model and would require additional calculations. But the exact number is not the key takeaway. What truly matters is building intuition — understanding what the solver suggests in theory and knowing how to adjust it against real opponents who deviate from optimal play.
Putting It All Together
What can we learn from this example?
Ace-high boards
This category clearly favors the preflop raiser. The Button usually holds more AA combinations, which gives them a range advantage.
As a result, betting big and betting often should be the default strategy. Since many opponents do not check-raise often enough, increasing your c-bet frequency slightly can be a profitable exploit in practice.
Straight boards
Straight boards are more dynamic. If your opponent has a proper leading strategy, your overall c-bet frequency should be lower than on Ace-high boards — although still relatively high.
However, against players who never lead, you should be more careful. Their checking range becomes stronger, increasing the risk of check-raises or betting into a more robust range.
Finally, Aggregate Reports in PLO Genius allow you to move from a broad category view to a specific board in seconds. You can quickly verify the exact strategy for any texture and study it in more detail whenever needed.

Why Aggregate Reports Matter
Aggregate Reports are powerful analytical tools.
Ignoring them means missing a major opportunity to improve. At first, the amount of data can feel overwhelming, but with regular practice, you learn how to turn thousands of combinations and board textures into clear patterns. That is how you build real intuition — and gain an edge over opponents who study in a less structured way.
The PLO Genius library already covers a wide range of common scenarios. Because the number of possible situations in PLO is enormous, we focus first on the most relevant and frequently played spots, and then expand step by step.
The Aggregate Reports feature is available in the PRO plan.