From PLO to PLO6: What Extra Hole Cards Can Really Change
More hole cards change which hands perform best and shape postflop decisions across PLO formats.

Ever wondered how much one or two extra hole cards actually change your strategy?
Move from regular PLO to PLO5 and then PLO6, and the number of possible combinations increases dramatically. But do optimal decisions change at the same rate?
The recent addition of PLO6 preflop and postflop solutions, together with our custom postflop solving feature, marked an important milestone in the development of PLO Genius. It significantly expanded the range of games and situations available to study — while also making it easier to compare how strategy evolves as more hole cards enter the picture.
In this article, we will examine a common, relatively straightforward spot to outline an answer to a broader question: how does range composition change, and how does this affect betting strategy as you move from PLO to PLO5 and PLO6? The subject is far too complex to cover exhaustively in a single article, but this comparison allows us to highlight some of the most important patterns.
The Scale of the Difference
Let’s start with the raw numbers.
Within the preflop solutions used for this comparison, the regular PLO setup is a Button vs. Big Blind single-raised pot at 100 BB. The Button arrives at the flop with roughly 103,000 possible hand combinations. That number grows to around 800,000 in PLO5 and approximately 6.7 million in 5-max PLO6.
Each additional hole card does more than simply add new possibilities. The increase is combinatorial rather than linear, which explains why the number of combinations grows so sharply from one format to the next.
One Flop Across Three Formats
To see what this means in practice, let’s examine how each format approaches a K-9-3 rainbow flop.
For this comparison, we use a no-donking strategy across all three games, with the Big Blind checking to the Button.
Here is the in-position player’s c-betting strategy, together with the number of combinations at each node.
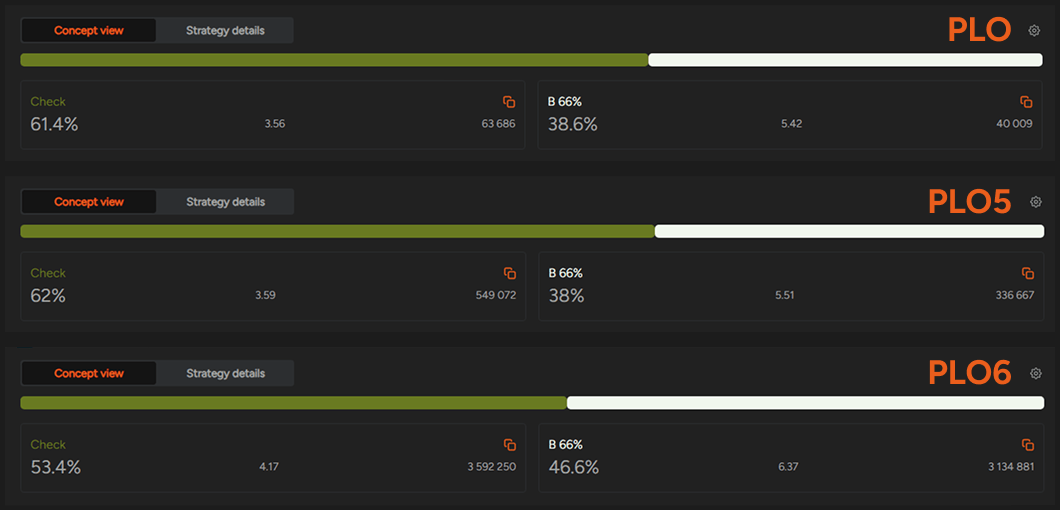
The difference in scale is enormous, ranging from around 40,000 combinations in PLO to 3.1 million in PLO6. The overall c-bet frequencies, however, do not diverge nearly as much. PLO and PLO5 remain relatively close, while PLO6 stands out with a c-bet frequency of 46.6%.
There is one important caveat before we compare these results directly. Our PLO6 simulations include an ante, making the pot 1 BB larger on the flop: 8.5 BB rather than 7.5 BB in PLO and PLO5. The six-card solution is also based on a 5-max game, meaning there is one fewer player at the table.
These settings reflect how PLO6 is commonly played today, but they also influence the ranges reaching the flop and the incentives behind individual actions. The comparison is therefore highly informative, but not perfectly like-for-like.
How the Ranges Themselves Change
The overall betting frequency tells only part of the story.
A closer look at range composition reveals much larger differences between the three games.
On a dry board like this, the strongest available made hands are sets and two pairs. The Button flops a set roughly 5.4% of the time in PLO, 8.2% in PLO5, and more than 11.4% in PLO6. The difference is even greater for two pairs: approximately 7.9% in PLO, 12.3% in PLO5, and 18.5% in PLO6.
The same pattern appears when we look at draws. Since a flush draw is not possible on this board, wraps and gutshots are the most relevant categories. The Button flops a wrap 2.4% of the time in PLO, 5.4% in PLO5, and almost 9% in PLO6.
Gutshots increase from roughly 24.4% in PLO to just over 49.1% in PLO6.
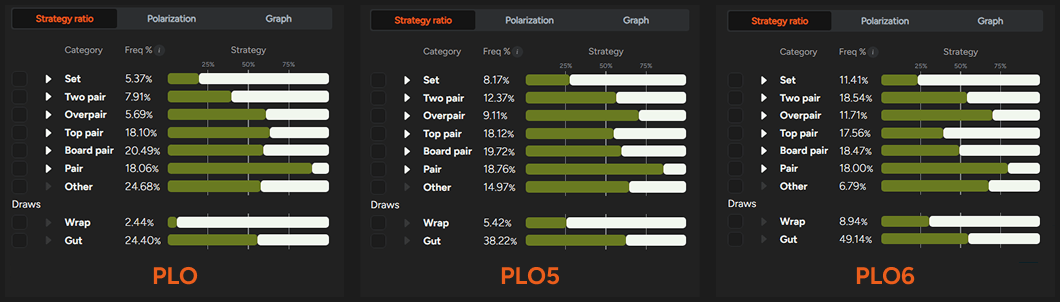
The additional cards therefore change not only the size of each range, but also the types of hands it contains. Strong made hands and straight draws become much more common, altering how individual holdings interact with the opponent’s range.
Similar Frequencies, Different Strategies
Despite the enormous difference in the number of combinations, the overall c-bet frequencies remain reasonably similar across the three formats — especially once the different PLO6 setup is taken into account.
The main distinction is therefore not simply how often the Button bets, but which hands make up the betting range.
Raw equity plays an important role, but it is not the only factor. Nut potential, blockers, the ability to continue against a check-raise, and playability across future streets all help determine which combinations should bet.
Sets and two pairs provide particularly clear examples of how these priorities change as more cards are added.
How Set Strategy Evolves
The overall c-bet frequency with sets falls from 80.8% in PLO to 72.5% in PLO5 before rising again to 77.2% in PLO6. These aggregate numbers, however, conceal considerable differences between bottom, middle, and top sets.
In PLO, bottom set is almost always bet. The main exceptions are double-paired combinations containing a pair of nines or kings, such as 9933 or KK33. Middle set is also played aggressively, with a c-bet frequency of around 90%. Top set is bet less often, at approximately 71.4%, leaving a meaningful portion of these combinations in the check-back range.
In PLO5, bottom set becomes a more ambiguous holding and is bet only 62.3% of the time. The combinations with the greatest incentive to bet are generally those supported by a wrap, which provides valuable additional equity and improves their ability to continue against aggression.
Middle set retains a relatively high c-bet frequency of 74.1%. Many combinations can bet without substantial additional equity, although holding a King is particularly valuable because it reduces the number of top-set combinations available to the Big Blind.
Top set is bet at a similar frequency of 73.8%, but the preferred combinations are notably different. The solver often favors betting “clean” top-set holdings without additional draws. These hands unblock more of the Big Blind’s continuing range, increasing the likelihood of receiving action from weaker holdings.
In PLO6, the c-bet frequency for bottom set falls further, to 54.9%. Betting decisions become even more dependent on the accompanying cards, with blockers, backdoor equity, and additional straight potential helping determine which combinations should bet.
Middle set maintains a frequency similar to PLO5 at 71.8%. Once again, a King among the side cards is desirable because it blocks some of the Big Blind’s top-set holdings, while additional straight coverage improves the hand’s prospects on future streets.
Top set moves in the opposite direction and is bet 83.3% of the time. Interestingly, combinations containing Q-J-T side cards are more willing to check back. Their extensive coverage across future streets allows them to realize equity well after checking, making them useful additions to the protected check-back range.
Why Two Pairs Needs More Support
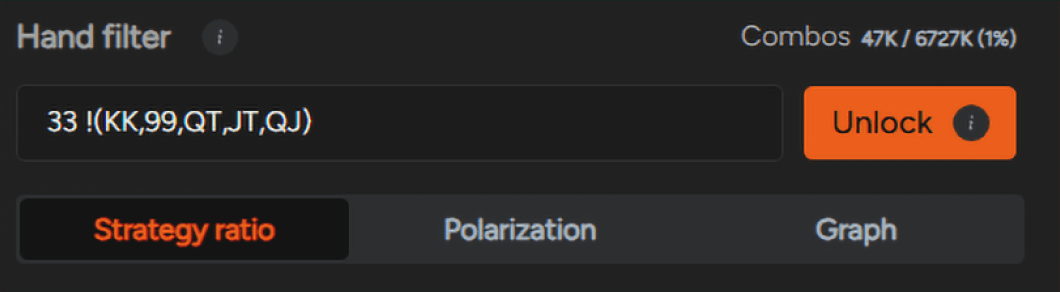
Two pairs tell a related story. It remains a strong made hand, but it is more vulnerable to changes in board texture and is increasingly dependent on its side cards as more hole cards are added.
Its overall c-bet frequency is 60.5% in PLO, 43.5% in PLO5, and 46.2% in PLO6.
In PLO, bottom two pairs — 93 — are bet only around 19.3% of the time. The selected bets are usually supported by a gutshot, a nut backdoor flush draw, or pocket Aces.
The c-bet frequency increases to 32% with K3. Here, the solver favors combinations with high side cards that provide additional straight potential. K9 is the clear favorite, with almost 87% of these hands being bet.
Many of the K9 combinations included in the checking range have less than 0.14 BB separating the EV of betting and checking in a 7.5 BB pot. This suggests that simplifying the strategy toward more frequent betting with top two pairs would carry only a modest EV cost.
In PLO5, the betting frequency for 93 falls sharply to just 9%. Most of the selected bets are Q-J-T-type combinations, indicating that much of their strategic value comes from the straight component rather than the two pair itself.
K3 follows a similar pattern, with its betting frequency dropping to approximately 16.8%. The solver again prioritizes hands containing at least two of Q, J, and T, as well as combinations with pocket aces.
K9 is the only two-pair category that the solver clearly favors betting, reaching a frequency of around 67% even without wrap support. Top two pair therefore remains a reasonably robust made hand on such a dry board, although it is still bet less often than in regular PLO.
In PLO6, the picture becomes more complex because both ranges contain six-card hands. A category such as bottom two pair now includes a much broader selection of blockers, redraws, and backdoor possibilities, making simple conclusions less reliable.
Bottom two pairs bet 25.5% of the time, but the selected combinations derive much of their value from wrap cards and the possibility of holding as many as three nut backdoor flush draws.
The situation is similar with K3, which is bet 26.7% of the time. Its strategy depends heavily on the other components of the hand, particularly those that provide a path toward the nuts on future streets.
Top two pair is the first two-pair category that does not require a wrap to support frequent betting. K9 has an overall c-bet frequency of approximately 62.6%. Even after filtering out combinations with the Q-T side-card component, the frequency remains around 42.2%, driven largely by hands containing pocket aces and multiple nut backdoor flush draws.

What to Take Away
That is a lot of numbers for one article, but three broader conclusions stand out.
First, the more cards each player holds, the less the basic made-hand category tells you about the correct action. A made hand that is an automatic bet and comfortable continuation against a raise in regular PLO can become a bet-fold or even a check-back in PLO5 or PLO6. The exact side cards become increasingly important.
Second, redraws and nut backdoor equity carry more weight as the number of hole cards increases. They improve a hand’s playability across future streets, provide additional ways to make the nuts, and can block the opponent’s strongest possible holdings.
Finally, every additional card adds another layer of strategic complexity. Even a small difference in side-card composition can significantly affect the preferred action. Without a reliable GTO baseline, identifying these differences at the table becomes extremely difficult.
The headline c-bet frequency may not always change dramatically, but the range behind it certainly does.
Studying PLO6 can be demanding, but that complexity also creates opportunities to build an edge. PLO Genius allows you to compare solved spots across PLO, PLO5, and PLO6 or request custom postflop calculations for the exact situations you want to study.